Are We There Yet? Creating Complete Communities for 21st Century America. (2012)
Reconnecting America
The COVID-19 pandemic has dramatically impacted families, businesses, and cities across the United States and the world. The disease has stressed the economy, affected resource delivery, and strained social systems of cities, all of which rely on regional and national networks to function. Members of households in all income brackets are struggling to meet their basic needs as they work from home, lose their jobs, or make the choice to work under challenging and potentially life-threatening conditions. The need for equitable access to jobs and resources has become all the more obvious as the pandemic continues to disrupt local economies.
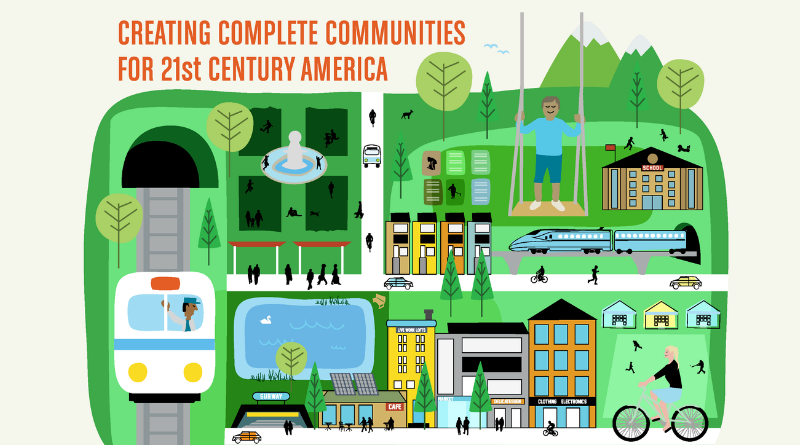
COVID-19 has highlighted a need for “complete communities,” defined by Reconnecting America as “places where people can live, work, move, and thrive in a healthier, more equitable, and more economically competitive way.” Reconnecting America’s 2012 report titled Are We There Yet? Creating Complete Communities for 21st Century America examines the metropolitan area characteristics that make them ideal communities where residents have access to the fundamentals of daily life. The report analyzes data from the 366 Metropolitan Statistical Areas (MSAs) in the country to determine which MSAs have successfully implemented complete communities’ standards throughout their neighborhoods, built on a foundation of “Opportunity Areas.”
Opportunity Areas
The report characterizes opportunity areas as “smaller blocks of moderate density housing or jobs” that follow the basic principles of smart growth. Their local scale provides a model for MSAs to follow to incorporate density, walkability, and accessibility practices throughout the region. Opportunity areas are not always complete communities unto themselves, but they contain many or all of the characteristics an MSA needs on a larger scale to be considered a complete community. Reconnecting America’s report emphasizes that MSAs can focus on facilitating complete community practices within small-scale opportunity areas, and then use these areas as building blocks to expand the principles and practices out into the larger metropolitan area. “Complete communities” usually refer to areas of neighborhood scale. However, this report analyzes how aggregates of opportunity areas can contribute to the overall “completeness” of an entire region.
Though complete communities exist on a neighborhood scale, the benefits of complete communities are regional in nature.
Reconnecting America
Research Methodology
Reconnecting America collected 33 data-based indicators across four categories (living, working, moving, and thriving) to grade each MSA in the country on its progress towards creating complete communities. The data was collected from numerous sources, including Reconnecting America’s own research, the U.S. Census Bureau, the Brookings Institution, the USDA Food Atlas, and other research entities. The analysis compiles data that reflects the quality of living, working, moving, and thriving in an area, such as access to fixed-guideway transit, affordable housing, employment density, and availability of food, arts, and neighborhood resources. Many of the indicators assess the organization of these factors within opportunity areas and within the MSAs – individual complete places which, when aggregated together, contribute to the comprehensiveness or “completeness” of the entire region.
The research sorted the country’s 366 MSAs into three categories based on population size – under 500,000, between 500,000 and 3 million, and greater than 3 million people. These were then sorted into quartiles for each indicator and assigned points for each quartile (4 points to the top quartile, 3 to the second quartile, 2 to the third quartile, and 1 in the lowest quartile). An MSA’s final score was an average of all its indicator scores.
The metrics and the composite grades we have developed for every MSA in the country indicate whether one region, and the communities that comprise that region, is closer to being complete than another. Reconnecting America
Reconnecting America
Transit Indicators
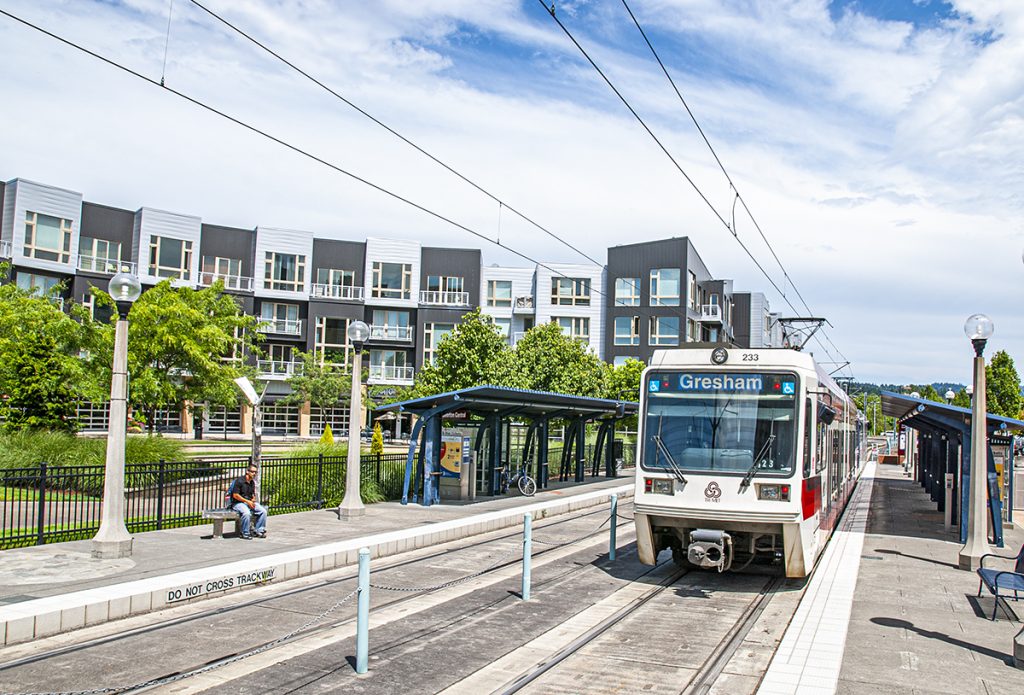
Many of the indicators Reconnecting America used to grade MSAs on their complete community characteristics relate to transit. The report specifically emphasizes access to fixed guideway transit, which reflects the fact that most people in large metropolitan areas do not live in the same place as they work or they conduct their daily activities. This access to fixed guideway transit would not be a necessary component of a “complete community” were residents to live, work, and play in the same neighborhood. However, for larger MSAs, it is required to ensure residents can access all living, working, moving, and thriving activities in the area. Some of the indicators also address equitable access to transit by considering the number of low-income jobs and affordable households near fixed guideway transit. See the table below for scored indicators related to transit.
MSA Scored Indicators Related to Transit
| Living | Working | Moving |
|---|---|---|
| Percent of households near fixed-guideway transit | Percent of jobs near existing fixed-guideway transit | Number of fixed-guideway transit stations |
| Percent of low-income households near fixed-guideway transit | Percent of jobs near planned fixed-guideway transit | Number of future fixed-guideway transit stations |
| Percent of Section 8/202 households near fixed-guideway transit | Percent of jobs accessible by transit (within a 45-minute commute) | Percent of fixed-guideway transit stations in opportunity areas |
| Percent of low- and moderate-income jobs accessible on transit (within a 90-minute commute) | Percent of commuters who take transit | |
| Percent of jobs near existing fixed-guideway transit | Change in number of commuters who take transit | |
| Pedestrian Danger Index | ||
| Percent of commuters who walk or bike | ||
| Average vehicle miles traveled per household |
New Jersey Scores

The MSAs in and around New Jersey received the following scores in each category. The New York/North Jersey, Atlantic City, and Trenton metro areas received some of the highest scores in their respective region size groups, mainly because of their transit facilities. These areas have high levels of fixed-guideway transit, provide more equitable access of this transit to low-income households, and have high percentages of households living in opportunity areas.
New Jersey Scores
| MSA | Region Size | % Households Living in Opportunity Areas | Living | Working | Moving | Thriving |
|---|---|---|---|---|---|---|
| New York-Northern NJ-Long Island, NY-NJ-PA | more than 3 million | 63.50% | A | A | A | A |
| Philadelphia-Camden-Wilmington, PA-NJ-DE-MD | more than 3 million | 33.70% | B | B | B | C |
| Atlantic City-Hammonton, NJ | less than 500,000 | 20.60% | A | A | A | B |
| Ocean City, NJ | less than 500,000 | Not available | C | B | A | B |
| Trenton-Ewing, NJ | less than 500,000 | 22.00% | A | A | A | A |
| Vineland-Millville-Bridgeton, NJ | less than 500,000 | Not available | B | C | C | D |
Facing the Future
As cities make efforts to curb the transmission of COVID-19 and reopen for business, Reconnecting America’s report provides examples of policy areas where cities can focus their improvement efforts to create more equitable and complete communities. Low-income families are some of the most affected by this pandemic, as their members represent a large number of essential workers and those working low-wage, hourly jobs. The report scores cities using several indicators that measure access by low-income families to jobs, transportation, and well-being features such as parks and grocery stores. City efforts to develop a new normal can prioritize these factors to help historically underserved populations recover and to ensure that these residents are better able to benefit from all of the resources a city has to offer.
Reconnecting America’s report provides a baseline that shows what was working in cities before the pandemic hit, as well as those conditions that need greater attention to create more equitable and complete communities. As the report states, all but 49 of the 366 metro regions analyzed in the report have at least one opportunity area from which they can begin building complete communities. This means that most major cities have a foundation to build on. Cities included in this report can focus their efforts to improve their scores or provide further support to the areas of strength that are reflected in those high scores. Cities with few or no opportunity areas can begin working on a local scale to create them in local neighborhoods.
The New York City metropolitan area’s high marks in a complete community score do not represent its susceptibility to COVID-19, aside from the fact that its public transit system and high ridership may have partially contributed to the spread of the disease. Studies have shown that COVID-19 has spread so rapidly in the city because of income segregation – many poor residents have little choice on whether to go to work during the crisis, and thus bring the virus back to neighborhoods that have limited healthcare access. Additionally, the city has a higher density of people within individual housing units, rather than throughout the city as a whole, a condition that exacerbates the spread of the virus within households. However, because of its high score, the New York City MSA is well-situated to continue expanding its complete communities principles to benefit a larger proportion of its residents. While there will be many influences involved in the pandemic recovery, the “completeness” of NYC and northern NJ represents the existing groundwork that will ensure that the city and the region make a vibrant comeback from this crisis.