
A report on the history of housing economics and demographics in New Jersey, authored by James W. Hughes and Connie Hughes, estimates that housing production in the 2020s will likely exceed that of each of the previous three decades and come close to matching the housing production boom of the 1980s. However, it remains unclear whether this increase in construction can sustain growing housing demand in New Jersey, the most densely populated state in the U.S.
Findings
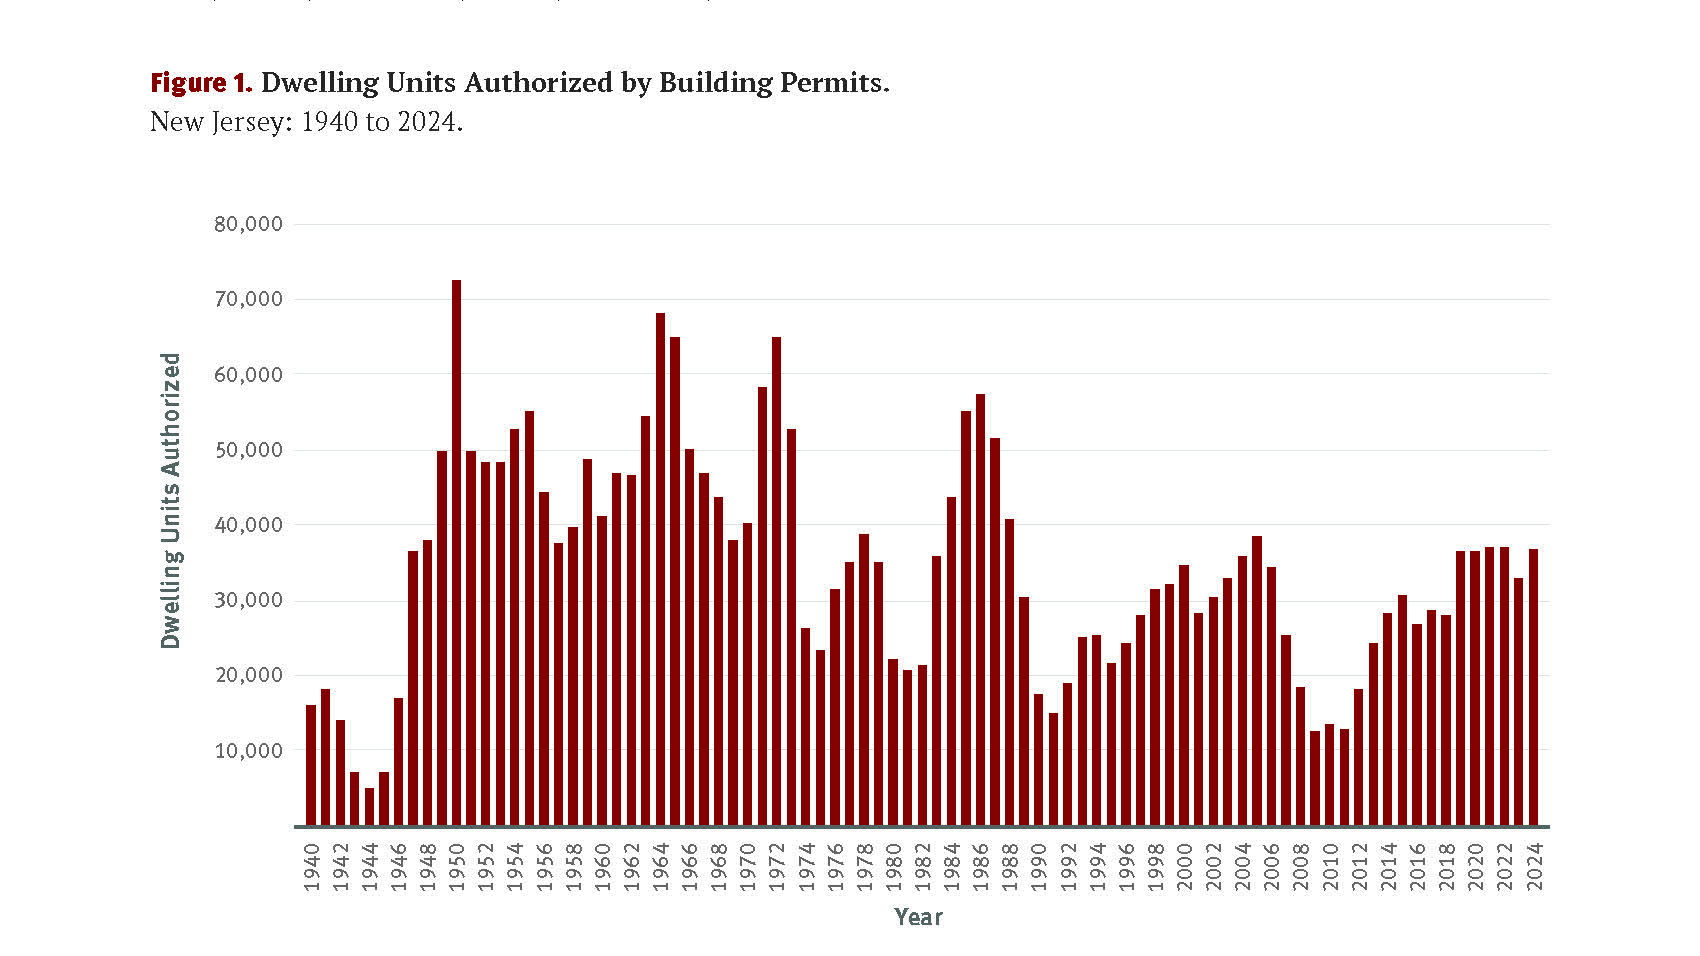
New Jersey housing construction peaked in 1950 with 72,657 units built; subsequent peaks and troughs in the following decades have both declined.
Economic recessions result in consistent housing production lows, such as in 2009 when the Great Recession produced the lowest yearly amount of housing units constructed in New Jersey—12,421 units—since World War 2. The short two-month recession caused by the COVID pandemic had no such adverse effect due to unprecedented federal stimulus measures. Since 2020, New Jersey has hovered at around 36,000 units produced each year, representing the highest five-year period since 1984 to 1988.
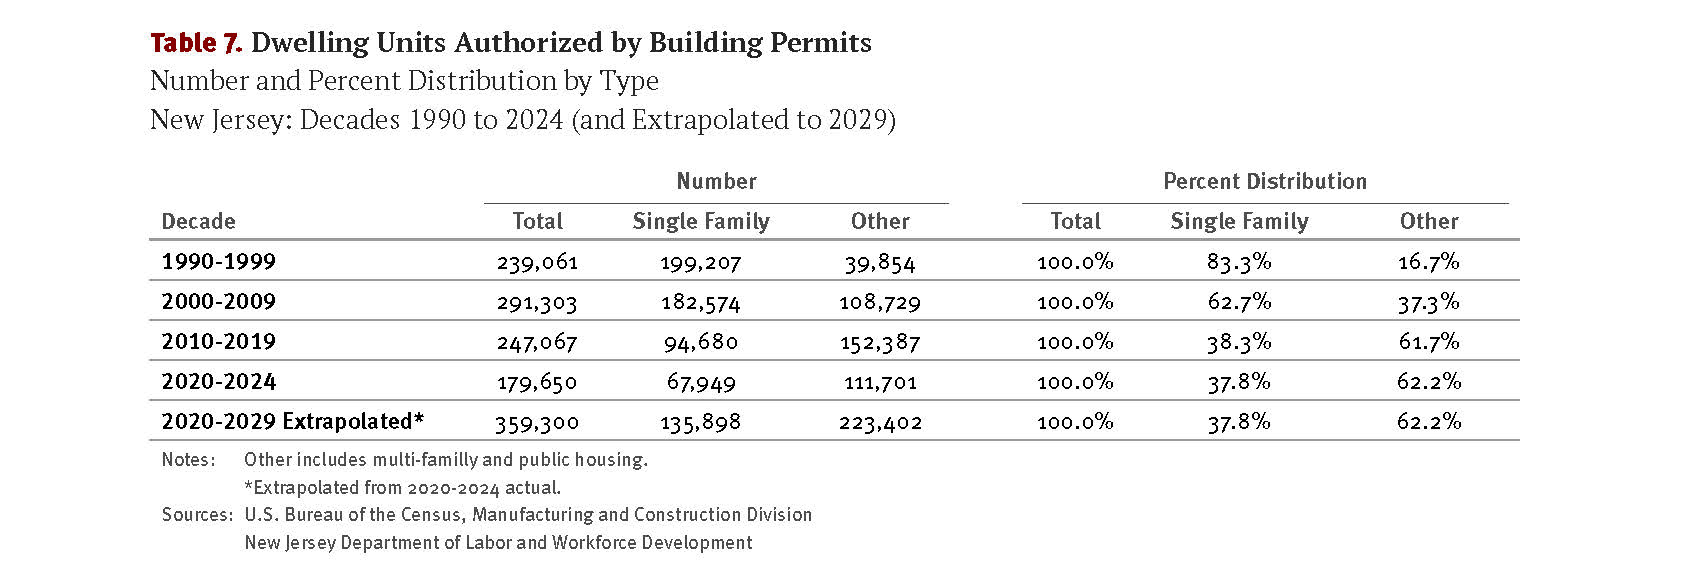
The 2020s are projected to yield 359,300 units, significantly higher than each of the previous three decades, which produced fewer than 300,000 units.
The types of growth have also changed. In New Jersey, housing growth during the late 20th-century prioritized suburbanization with Ocean, Middlesex, and Monmouth as the fastest-growing counties. Modern growth, in contrast, has been defined by a maturing postsuburban economy as obsolete commercial and office-campus venues are redeveloped and young professionals move back into the cities. In the 21st century, Hudson County has experienced the most growth.
Impacts on Housing Production
While the business cycle dictates short-term changes in housing production, long-term changes are shaped by broader shifts in the spatial economy, population change, and generational demographics.
Structural Changes in the State Economy
New Jersey’s housing history can be understood through four distinct economic periods:
- Postwar Affluence and Consumer-Driven Manufacturing (1945–1970): Manufacturing peaked in 1969 at 33 percent of all state jobs. The Baby Boom and domestic migration drove population growth well above the national average, and peak employment growth in the 1950s and 60s increased buying power for housing.
- The Troubled Decade and Postindustrial Transformation (1970–1980): Globalization contracted the manufacturing economy. Population growth fell from 18 percent in the 1960s to just 2.7 percent in the 1970s, with 23 percent less employment growth compared to the prior decade.
- Transformational Suburban Economic Growth (1980–2000): The knowledge-based, information-age economy took hold. Suburbanization of offices and higher-income earners gave rise to New Jersey’s “edge cities” and the Central New Jersey Wealth Belt, though gains were tempered by the 1989–1992 recession and an overbuilt suburban office market.
- A Maturing Postsuburban Economy (Post-2000): Technological advances ushered in the internet age, and urban revitalization attracted higher-density development in once-neglected downtowns. The period also saw the highest postwar job losses due to the Great Recession and the COVID pandemic.
Generational Demographics
Five generations have defined postwar population growth and housing demand:
- Baby Boomers (1946–1964): A massive postwar surge in births peaked in 1957. A record number of Boomers will turn 65 from 2024 to 2027.
- Gen X (1965–1980): A sharp drop in births followed the Boom, though high immigration helped bolster this generation’s size.
- Millennials (1981–1996): The first generation raised in the digital age and the largest by population. During the 2020s, Millennials entered the family-raising stage of life, resulting in changed housing preferences.
- Gen Z (1997–2012): Nearly the size of the Millennials due to continued immigration growth, and a new force in the rental market. Gen Z is the first generation raised entirely in the internet age.
- Gen Alpha (2013–Present): Declining post-recession birth rates define Gen Alpha, the first generation raised in the AI age.
These generations correspond to five eras of housing demand in New Jersey, moving from postwar Levittown-style suburbs and peak production, through townhouse and condo diversification, McMansion trade-up markets, millennial-driven urban live-work-play environments, and finally the pandemic-fueled millennial move back to the suburbs.
Final Thoughts
New Jersey has seen a shift from prewar farmlands to postwar suburbia to high-density urban redevelopment. The determinants of these shifts include short-term cyclical economic factors, long-term structural economic change, population growth, and generational demographics.
Short-term recessions and expansions will continue to heavily influence the housing market. Longer-term patterns—such as the rise of hybrid and remote work—will have more pronounced and lasting effects. Current changes in federal immigration policy and declining birth rates have the potential to permanently shift both housing demand and the supply due to construction labor shortages.
As Millennials enter prime family-raising years, the availability of appropriate suburban housing comes into question. They have now overtaken Baby Boomers in terms of share of the housing market. By 2030, the first three postwar generations will be fully established in the market. Gen Z may face an even more difficult path to homeownership, as the median age of first-time buyers has risen steadily over time.