Guide to Joint Development for Public Transportation Agencies. (2021). Transportation Cooperative Research Program (TCRP), Transportation Research Board. National Academies of Sciences, Engineering, and Medicine. Washington, DC: The National Academies Press.
The Transportation Research Board released the Guide to Joint Development for Public Transportation Agencies through its Transportation Cooperative Research Program (TCRP). The report, developed for public transit agencies interested in the process, provides detailed guidelines and best practices culled from interviews with agency practitioners, participating municipalities, and private developers.

Joint Development (JD) is defined as “Real estate development that occurs on transit agency property or through some other type of development transaction to which the transit agency is a party.”
The report makes clear, however, that joint development is not a subset of Transit Oriented Development (TOD), but a means of achieving this type of land use outcome. Joint Development does not necessarily lead to TOD, and therefore, policies must be intentionally tuned to have similar results. With the right design, this process has the potential to transform transit and land use in a station area.
Joint Developments must be market sensitive: the guide makes clear that unless such projects are financially advantageous, a developer will have little incentive to participate. A “push-pull” relationship exists between the transit agency and the developer over the land’s value. Among other areas of discussion, the guide explores how structured parking and affordable housing frequently affect negotiations between the agency and the developer.
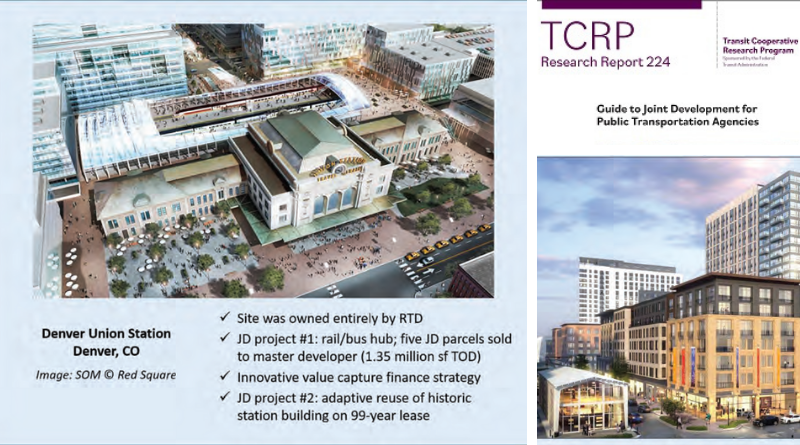
The TRB report offers several examples of agencies that have advanced development utilizing the Joint Development model, and provides recommendations for others looking to innovate. Agencies are advised to explore Joint Development in hub stations and transit centers, such as in the redevelopment of Denver’s Union Station. They could also look to partner with sister agencies that may hold station-area land. In St. Paul, for example, the City and Metro Transit are working in conjunction to develop land near a new soccer stadium and where light rail and bus rapid transit lines intersect. Agencies may also wish to partner with developers on infill station development, as the Massachusetts Bay Transit Agency (MBTA) did with Federal Realty Investment Trust for Assembly Row Station in Somerville. When assessing potential Joint Development sites, planners should consider non-station assets. San Francisco’s Muni is currently building new affordable housing by integrating it into a bus yard modernization project. Finally, agencies should consider Joint Development at the beginning of the transit expansion planning process, as Sound Transit in Seattle is doing with their Federal Way Station plan.
The Guide concludes with a rubric (included below) for measuring how Joint Development can help increase transit ridership, drive revenue, and grow transit-oriented development in the near-, mid-, and long-term. This resource demonstrates, in-depth, the planning and intentionality necessary for Joint Development success.
Conceptual metrics for joint development outcomes (p. 137)
| A. Near-Term | B. Mid-Term | C. Long-Term | |
| Implementation of JD project(s) | Broader station-area and corridor investment | “Moving the needle” on land-use and mobility | |
| Ridership Outcomes |
|
|
|
| Financial Outcomes |
|
|
|
| TOD / Smart Growth Outcomes |
|
|
|

