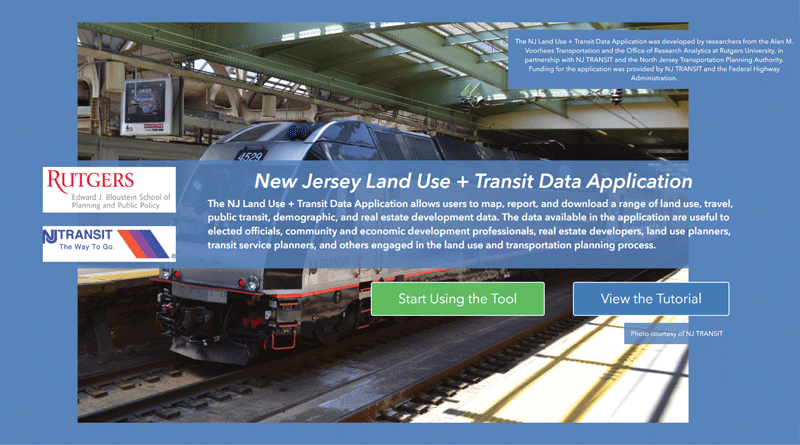
New Jersey’s transit network is one of the state’s best assets, and how we use it and build around it matter. Businesses throughout the tristate region depend on the transit system to tap into the New Jersey labor market. Developers look for opportunities to invest around stations. And New Jersey residents look to public officials to ensure spending on transit and redevelopment are wise investments. A new online application developed by NJ TRANSIT and Rutgers University is now available to employers, taxpayers, public officials, and developers alike to ensure these important decisions are informed by data.
NJLUTRANS (the New Jersey Land Use + Transit Data Application) gives users a way to learn about new development and redevelopment coming to their neighborhoods and to explore the essential link between land use and transportation through maps and data. First launched in 2017, NJLUTRANS is a GIS-based land use and transit planning web application created for NJ TRANSIT and the North Jersey Transportation Planning Authority (NJTPA) by researchers at Rutgers University’s Alan M. Voorhees Transportation Center (RU-VTC) and Office of Research Analytics (RU-ORA). NJLUTRANS provides access to a wide range of data useful to those interested in transit-oriented development. It allows users to explore, analyze, map, report, and export data for different geographic areas such as transit station areas, municipalities, and counties, as well as areas defined by the user.
What is New Jersey Land Use + Transit Data Application (NJLUTRANS)?
One-stop data source for demographic, land use & environmental, real estate valuation, transit service, and hard-to-obtain development data
Resource provides mapping, preformatted and self-generated graphical reports, as well as downloadable data
NJLUTRANS combines established national and New Jersey state data sources (such as US Census, NJ Departments of Transportation, Community Affairs, and Agriculture) with information from local transit agencies. More importantly, the application offers a database of local development application information compiled from municipal planning and zoning board records for each town located along the Hudson Bergen Light Rail line (Bayonne, Hoboken, Jersey City, North Bergen, Union City, and West New York) as well as Leonia in Bergen County. Data for the City of Newark in Essex County will be added soon. These local planning and zoning board data are available from no other online source and there are plans to expand the dataset geographically in the future.
Users of NJLUTRANS can access the approximately 50 tabular and spatial datasets on: population, employment, and other demographics; land use and environmental conditions; real estate valuation; transit lines, stops, and stations; and development including location, number of housing units, square footage of non-residential space, parking information, and project status.
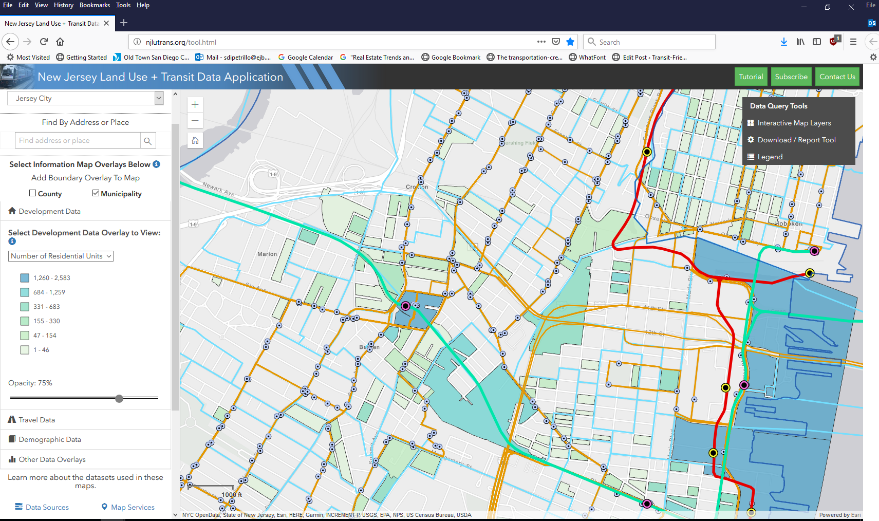
Interactive Data Layers & Custom Spatial Selection Tool
NJLUTRANS allows users to visualize and retrieve detailed data at different geographies, such as parcel blocks, census block groups, municipalities, and counties. Users can also select custom geographies using the Download Tool and Report Tool and can choose between several selection tools including: point, line, freehand line, circle, and freehand polygon to define areas of interest. These tools allow users to aggregate data to various levels of geography, from the neighborhood level to large regions.
Report Tool
Users can generate custom data reports that provide snapshot information for a variety of geographies. Each report contains tabular and graphical data in a printer-friendly format. Users can also select from various pre-defined geographies such as county, municipality, rail station (¼- or ½-mile station buffer areas), or from a custom selection from the Spatial Selection Tool. Users can also select from the various data topics. All data for the report are extracted from the database and compiled in real time.
Download Tool
In addition to generating reports, the application allows users to download the raw tabular data utilized throughout the application. Users can select from the same geographies (using the custom spatial selection tool) and data topics as with the Report Tool and receive a ZIP file containing an organized set of CSV files with all the relevant datasets. The CSV files are generated in real time from the database based on the user’s selections.
Map Services
To encourage use of the available spatial datasets by GIS professionals and others, all map services utilized by the data application are made available via the ArcGIS Server REST Services Directory.
Making Informed Decisions
These data, and the reports that the application provides, can help different users make more informed decisions. Local residents and business owners can use NJLUTRANS to help with their decisions to: expand, relocate, or start a business; to decide on whether and where to purchase real estate; or to move forward with a renovation of an existing home or business. Land developers and builders can also utilize the application to: identify locations for new projects; understand where a city’s development is focused; or to inform their decisions to purchase real estate, renovate or reuse an existing building, or construct a new building. For those working in the public sector, the application offers a way to better understand the opportunities for, and the barriers to, attracting TOD in their communities by documenting current development and its relationship to available resources, including public transportation. The application can also help demonstrate how public resources such as transit are used effectively.
Plans for the future: More data, more locations
The NJLUTRANS application continues to expand and improve. In addition to expanding the local development application dataset to new locations, the application developers have plans to add data on high-frequency bus corridors and stops and to incorporate new data layers such as flood hazard areas.
Want to learn more about the New Jersey Land Use + Transit Data Application?
While many users familiar with online mapping applications will likely find the NJLUTRANS data application easy and intuitive to use, the online interface includes both a step-by-step tutorial and embedded information links, denoted by the symbol ![]() . Users can also sign up to receive email updates when new features and data are added.
. Users can also sign up to receive email updates when new features and data are added.
And coming on May 29th, RU-VTC and NJ TRANSIT will host a webinar and live demonstration of the data application where they will discuss implemented and proposed updates to the application and ways in which users can utilize the application’s functions. To sign up for the webinar, go to NJLUTRANS.org v1.2.