The US Environmental Protection Agency’s Office of Sustainable Communities has published a Smart Location Mapping resource website to better understand the effect of land use/urban form on transportation outcomes. The agency has made two new data products available through the site to explore location efficiency: the Smart Location Database and the Access to Jobs and Workers via Transit Tool. Use of these tools can help to address a number of areas including analyses of neighborhood conditions, evaluating potential development locations, scenario planning/travel demand modeling, and comparing urban form among metropolitan areas. User groups, including real estate developers, regional planning organizations, municipalities, and other stakeholders interested in location efficient land use, can leverage these resources.
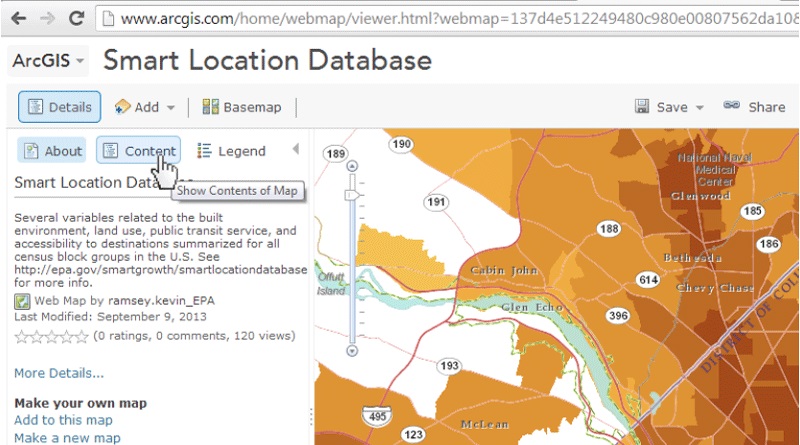
The Smart Location Database conflates more than 90 attributes of data on residential density, land use diversity, neighborhood design, accessibility, transit service, employment, and demographics to measure location efficiency. Many of the input attributes are refined to the Census block level. The database was first published in 2011 and Version 2.0 was release in July 2013; it is available nation-wide. The EPA hosted a webinar on May 15, 2014 that provided more details on the Smart Location Database. [The webinar is no longer available online. Email smartgrowth@epa.gov to request the slides and recording.]
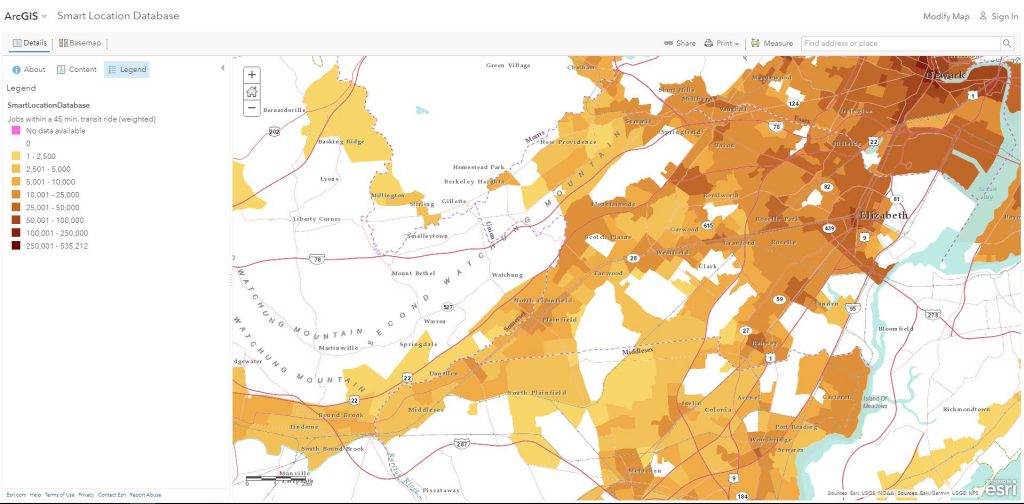
The Access to Jobs and Workers via Transit Tool combines data on employment and transit availability to illustrate neighborhood accessibility. The data are available for metropolitan regions served by transit agencies that have shared their service data in accordance with the General Transit Feed Specification (GTFS).
Each data resource is available in a variety of formats. Interactive maps have been developed to dynamically and quickly display information. Users can zoom to their community and view a number of attributes associated with each dataset. ArcGIS users can download shapefiles and geodatabases for use in desktop applications. Finally, the data is also available in non-spatial tabular format for other forms of analysis.