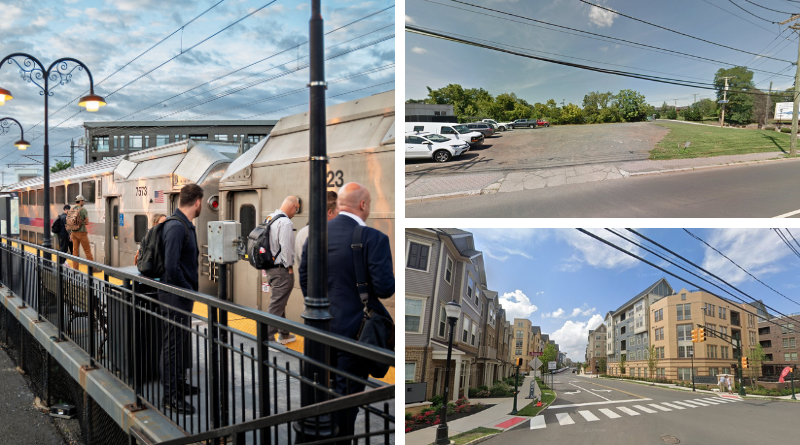
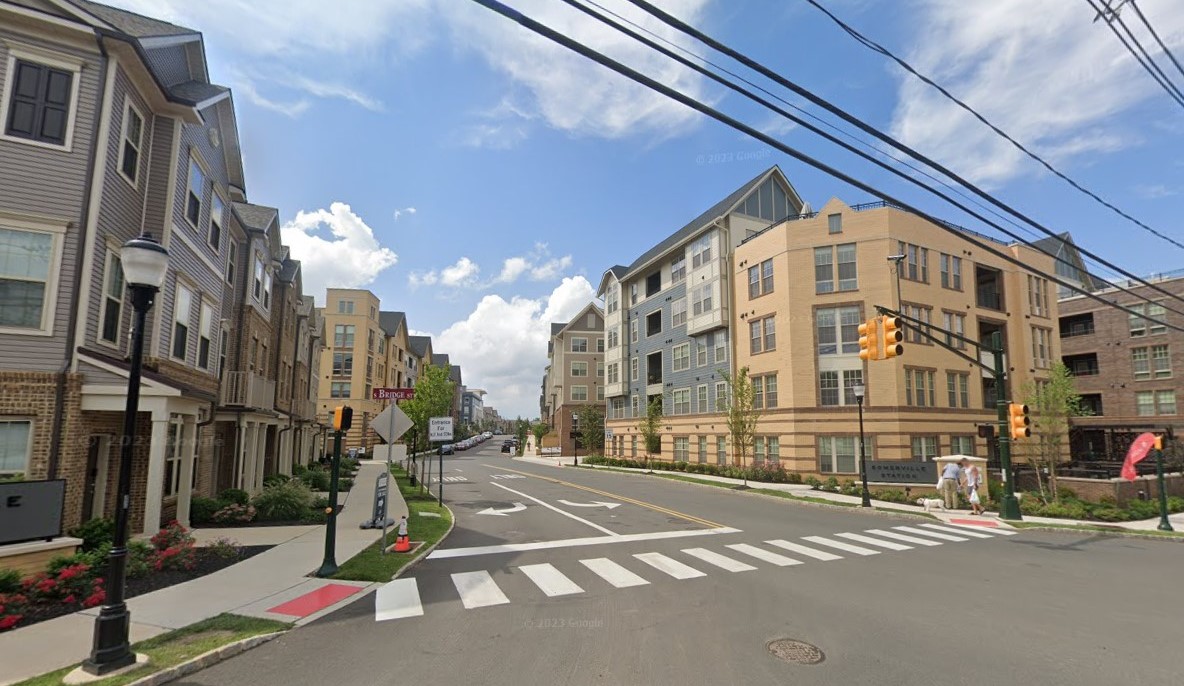
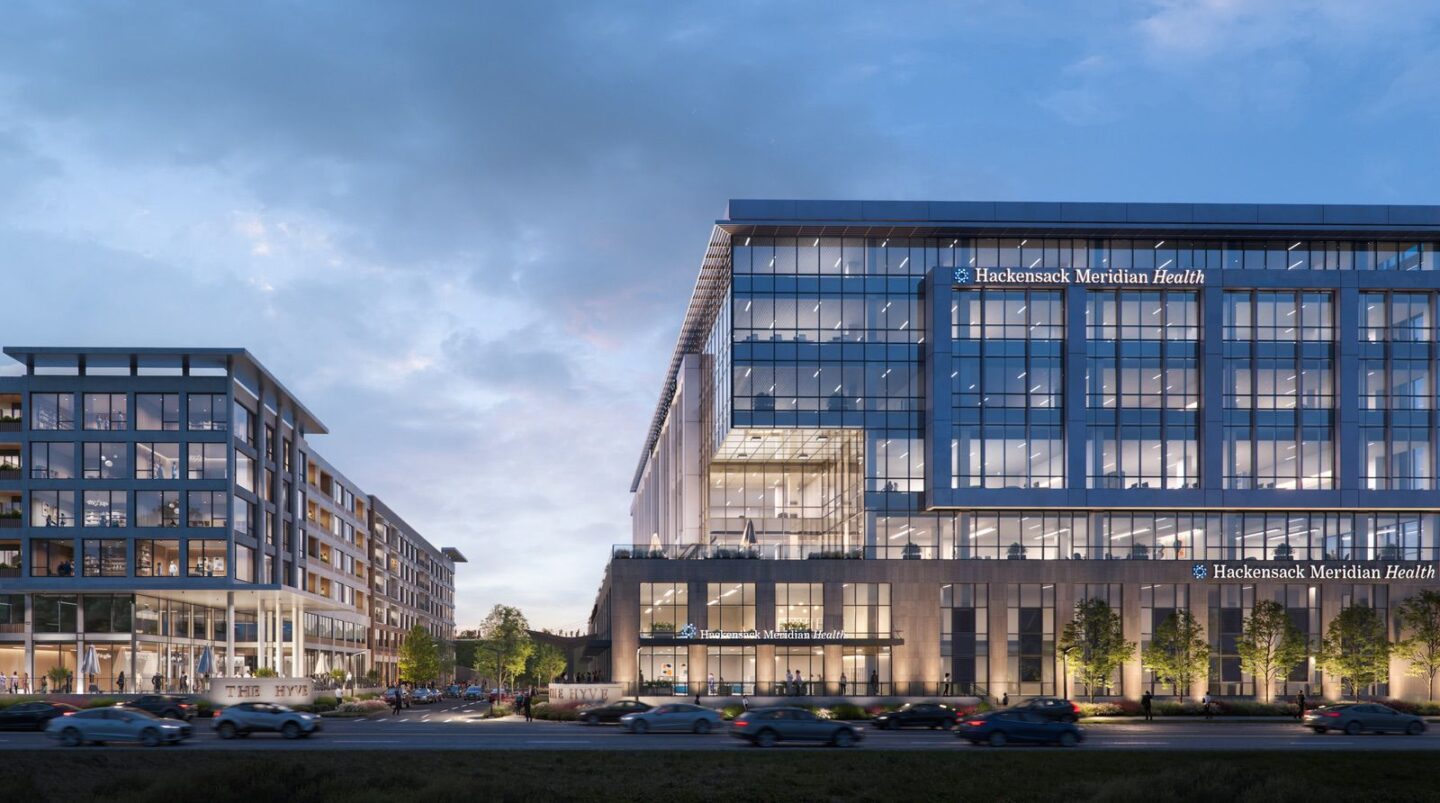
Red Bank Station (NJ TRANSIT) left; Somerville Station in 2012 and 2024 (Google Street View) right top-to-bottom
Many current planning debates center on a shared idea: communities function best when housing, jobs, services, and transportation are located close together. These ideas appear under different names—Smart Growth, the 15-Minute City, Abundance, and transit-friendly planning—but they reflect a common approach to organizing the built environment.
While the terminology may change, the principles do not. They reflect lessons drawn from centuries of urban development and already shape many of New Jersey’s older communities and historic downtowns. Common features include a vibrant main street commercial corridor, walkable neighborhoods with middle housing such as duplexes and townhomes, mixed-use buildings, and convenient access to public transit. Together, these elements demonstrate how compact development patterns can support strong local economies and livable neighborhoods.

The release of the 2025 New Jersey State Development and Redevelopment Plan, which explicitly endorses transit-friendly growth patterns, has renewed attention to these ideas. At the same time, an ongoing housing affordability crisis, rising concerns about residential property taxes, and growing demand from Millennial and Gen Z residents for walkable communities have further contributed to municipal interest in planning for smart growth and transit-oriented development.
However, meaningful implementation remains challenging. Many municipalities struggle with where to begin, face existing land use and circulation patterns that are incompatible with compact mixed-use development, and must build community understanding and support. Addressing these barriers is essential to translating policy goals into tangible, transit-friendly places that meet today’s economic, environmental, and housing needs.
Features of Transit-Friendly Planning
Transit-friendly planning—including transit-oriented development (TOD) and other smart growth strategies—focuses on concentrating housing, jobs, and activity near transit while supporting walkable environments. Although transit-friendly planning typically includes a mix of uses, residential density, pedestrian infrastructure, and access to transit, these strategies should be implemented according to the community’s characteristics. While dense urban centers often exemplify walkable, transit-friendly communities, many smaller New Jersey municipalities have also succeeded in embracing this form of growth. At the same time, some communities assume that transit-friendly planning only applies to towns and cities with rail access. To illustrate how these principles can take different forms across the state, the following examples highlight three very different New Jersey communities: Old Bridge, Somerville, and Jersey City.
Old Bridge
Old Bridge demonstrates that these strategies can succeed at a lower density—even without rail access. Despite the strong association between rail and TOD, the majority of New Jersey transit riders travel by bus. In 2025, NJ TRANSIT provided 141 million bus trips, compared to 59.7 million rail trips and 22.5 million light rail trips. Among New Jersey’s bus corridors, the Route 9 Corridor, which passes through Old Bridge, is one of the busiest. It carries roughly 6,500 daily weekday boardings and offers 40-minute trips to the Port Authority Bus Terminal in midtown Manhattan.
Old Bridge began exploring transit-friendly planning in the late 2010s by allowing for higher residential densities around the Old Bridge Park and Ride, and exploring designation by the Transit Village Initiative. From 2018 to 2021, Old Bridge approved the construction of 1,033 new multifamily units, compared with just 116 units between 2004 and 2017. Much of this development is clustered near the park-and-ride and bus stops at Old Mill Road and Schulmeister Road. However, the projects also highlighted several infrastructure gaps. Limited sidewalks and physical barriers between residential areas and transit facilities reduced safe pedestrian access to bus stops and the park-and-ride. Addressing these connectivity issues became a key focus of subsequent planning efforts.
To support new development and guide future growth, Old Bridge partnered with NJ TRANSIT’s Transit Friendly Planning Program to explore planning opportunities along the Route 9 corridor. Funded through a $470,000 Federal Transit Administration (FTA) Pilot Program for TOD Planning grant, NJ TRANSIT produced a comprehensive corridor plan with significant focus on Old Bridge. The study identified growth strategies, including constructing pedestrian bridges, expanding sidewalks, allowing mixed-use developments to create a commercial main street, utilizing state-owned land such as the NJ TRANSIT parking lot, and clustering higher-density housing near transit stops.
Across the Old Bridge Park and Ride and the Old Mill Road and Schulmeister Road area, the study estimated potential capacity of 4,300 new housing units, 105,000 sq. ft. of retail space, and 32 acres of public green space. This growth could be supported by nearby employment centers, including the new 4.2 million sq. ft. Central 9 Logistics Park, expected to generate more than 2,000 new jobs, and The Oaks at Glenwood, a project anticipated to add 1,056 townhomes.
In early 2025, Old Bridge explored applying for Transit Village designation, which, if approved, would provide access to annual capital funding for improvements near transit areas. By building on existing bus infrastructure, Old Bridge has already attracted millions of dollars of investment, supported new housing development, and positioned the park-and-ride area as a potential growth center. Future projects and policy changes could further strengthen this corridor and help establish a vibrant commercial district around the transit hub.
Planning lesson: Bus corridors and park-and-ride facilities can function as anchors for transit-friendly growth when zoning, pedestrian access, and land use planning support compact development.
Somerville
Somerville demonstrates how transit-friendly planning strategies can succeed even in places without high-frequency transit service near major job centers. Located in the western third of the Raritan Valley Line, Somerville provides one-hour trips to Newark and about 85-minute trips to New York Penn Station. Despite the longer travel time, the Somerville station area has experienced some of the fastest population growth along the corridor, increasing from 12,346 residents in 2020 to 14,428 in 2024, according to the American Community Survey.
Somerville’s growth reflects both proactive planning and changing market trends. Demand for walkable downtowns has increased as retail activity shifts away from malls and toward smaller commercial districts. Somerville leveraged this shift through transit-friendly planning strategies that strengthened its downtown and station area.
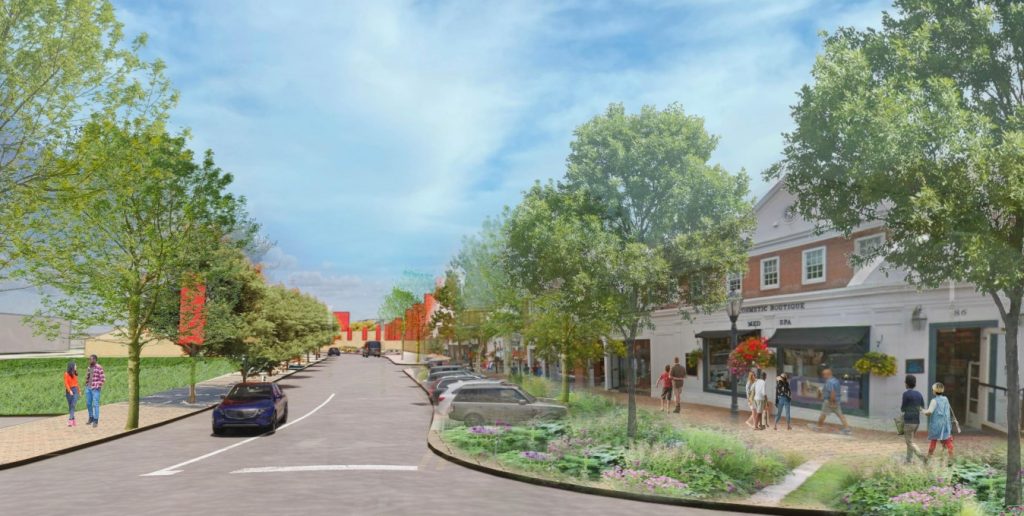
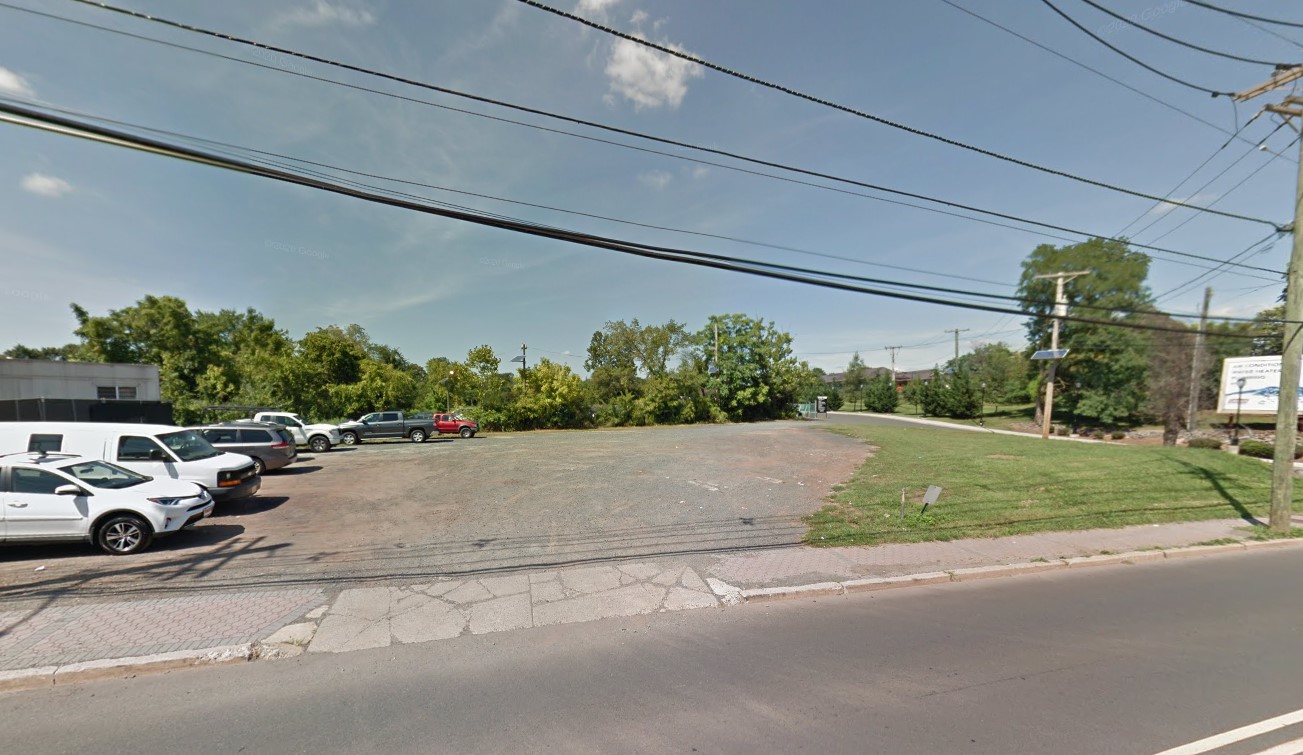
Planning strategies included the Somerville Station Area and Landfill Vision Plan, which explored opportunities to redevelop the brownfield near the station. This effort contributed to upzoning areas around the station and Main Street, application and designation as a Transit Village, and the introduction of public art projects to enhance the downtown.
As part of the Transit Village Initiative, Somerville received a $130,000 pedestrian infrastructure grant to improve Division Street. Construction initially required closing the street to automobile traffic. The change proved so popular that the Borough permanently converted Division Street into a pedestrian space. Within 18 months, the street went from a 50 percent vacancy rate to full occupancy, becoming a central destination for dining and entertainment.
At the same time, the rise of experiential shopping has contributed to a shift from regional malls and towards downtown commercial districts. Somerville emerged as a regional destination known for small businesses and a vibrant food scene. Developers, encouraged by the Borough’s planning policies—including mixed-use zoning, higher residential densities, and PILOT incentives—began investing in new projects.
Recent downtown developments include the 117-unit Cobalt Apartments, the 258-unit Edge at Main, and the 545-unit apartment and townhome development by PulteGroup and AvalonBay at Somerville Station.
Planning lesson: Communities with moderate transit service can strengthen downtown economies by aligning land use planning, pedestrian improvements, and redevelopment policies around transit stations.
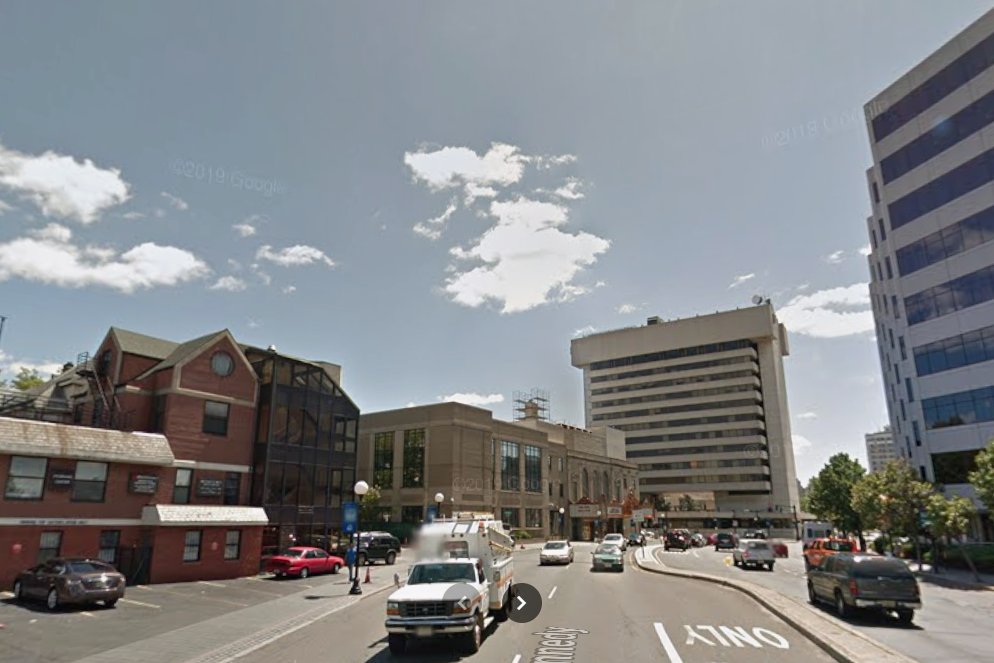
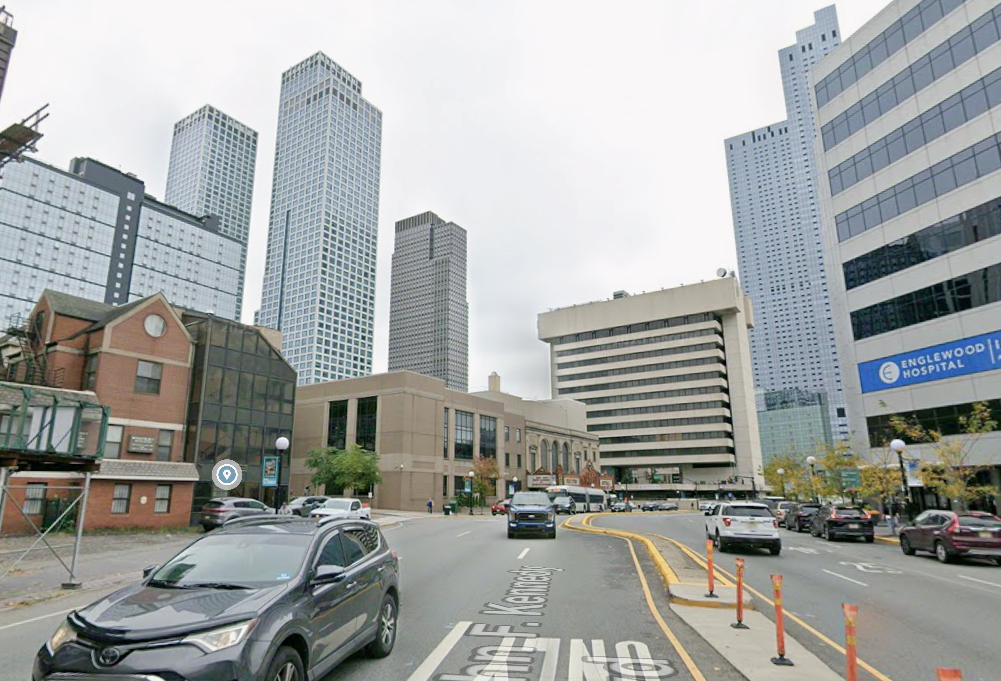
Jersey City
As New Jersey’s second-largest city, Jersey City exhibits many characteristics associated with smart growth: high-density mixed-use development, multimodal transit hubs, walkable neighborhoods, and active public spaces. While these growth patterns are supported by the city’s compact geography (under 15 sq. mi.) and proximity to Manhattan, its apartment construction outpaced that of every other city in the Northeast from 2013 to 2022 (the metric counted each NYC borough as its own city)—this recent development has also been shaped by deliberate transit-friendly planning strategies.
Whereas New York City added four new homes per 1,000 residents in 2024—its largest total since 1965— Jersey City added 13 new homes per 1,000 residents. As a result, the city’s population grew from 247,597 in 2010 to 302,284 in 2024. Much of this growth occurred near the Journal Square Transportation Center and stations along the Hudson-Bergen Light Rail.
Two factors helped Jersey City accomplish this growth: employment expansion in the Manhattan economy during the 1990s and 2000s, which accelerated in the 2010s, and proactive transit-friendly planning policies.
In the 1970s, Jersey City—attempting to combat urban flight—rezoned much of its downtown areas near PATH stations for significantly higher densities. These efforts included the Exchange Place redevelopment plan, which allowed for projects to reach a floor area ratio (FAR) of up to 15 around the PATH station.
By comparison, the 1961 New York City zoning ordinance generally limited downtown Manhattan to an FAR of 12 unless projects navigated complex incentive zoning policies. Additionally, New Jersey’s introduction of Payment in Lieu of Taxes (PILOTs) agreements allowed Jersey City to offer financial incentives to developers considering investment in the city.
Initially, these efforts did not produce substantial redevelopment, as both New York and northern New Jersey experienced economic stagnation and job losses during the 1970s and 1980s. However, conditions shifted in the 1990s and early 2000s as New York City’s financial sector expanded significantly, attracting development to both sides of the Hudson River. NJ TRANSIT’s construction of the Hudson-Bergen Light Rail further expanded TOD opportunities, and the 2010 Journal Square redevelopment plan—which permitted FARs up to 25—triggered a new wave of development.
The post-2008 economic recovery ultimately accelerated this trend. Driven by growth in Manhattan’s technology, healthcare, tourism, and professional service sectors, New York City added 500,000 private sector jobs between 2010 and 2015. However, this surge of development has also created challenges. The rapid growth in population and infrastructure—combined with rising costs for labor and healthcare, and the widespread use of PILOTs—has led to significant budget shortfalls. One-time revenue sources rose from 4.5 percent to 25 percent of the city’s budget, and now Jersey City will require major austerity or a bailout. Jersey City represents a cautionary example of how municipalities can attract investment and increase economic development, but municipal revenue needs to be able to match the rise in costs related to new investments.
Planning lesson: Jersey City demonstrates how zoning flexibility and strong transit access can enable large-scale housing growth near transit hubs, but widespread use of PILOTs and other profligate strategies may lead to budgetary shortfalls.
Benefits of Transit-Friendly Growth
As seen in Old Bridge, Somerville, and Jersey City, transit-friendly planning can succeed in a wide range of contexts. In Somerville, it helped reinforce a revitalized downtown. In Old Bridge, it is shaping new development along a major bus corridor. In Jersey City, transit access has supported large-scale residential and commercial growth. More generally, growth is enabled by zoning that allows mixed-use development and higher residential densities near transit. When supported by favorable market conditions, the policies can attract new investment, support local businesses, and strengthen downtown activity.
Additional benefits include diversifying the municipal tax base, reducing congestion, advancing environmental sustainability, and supporting affordability.
Diversified Tax Base
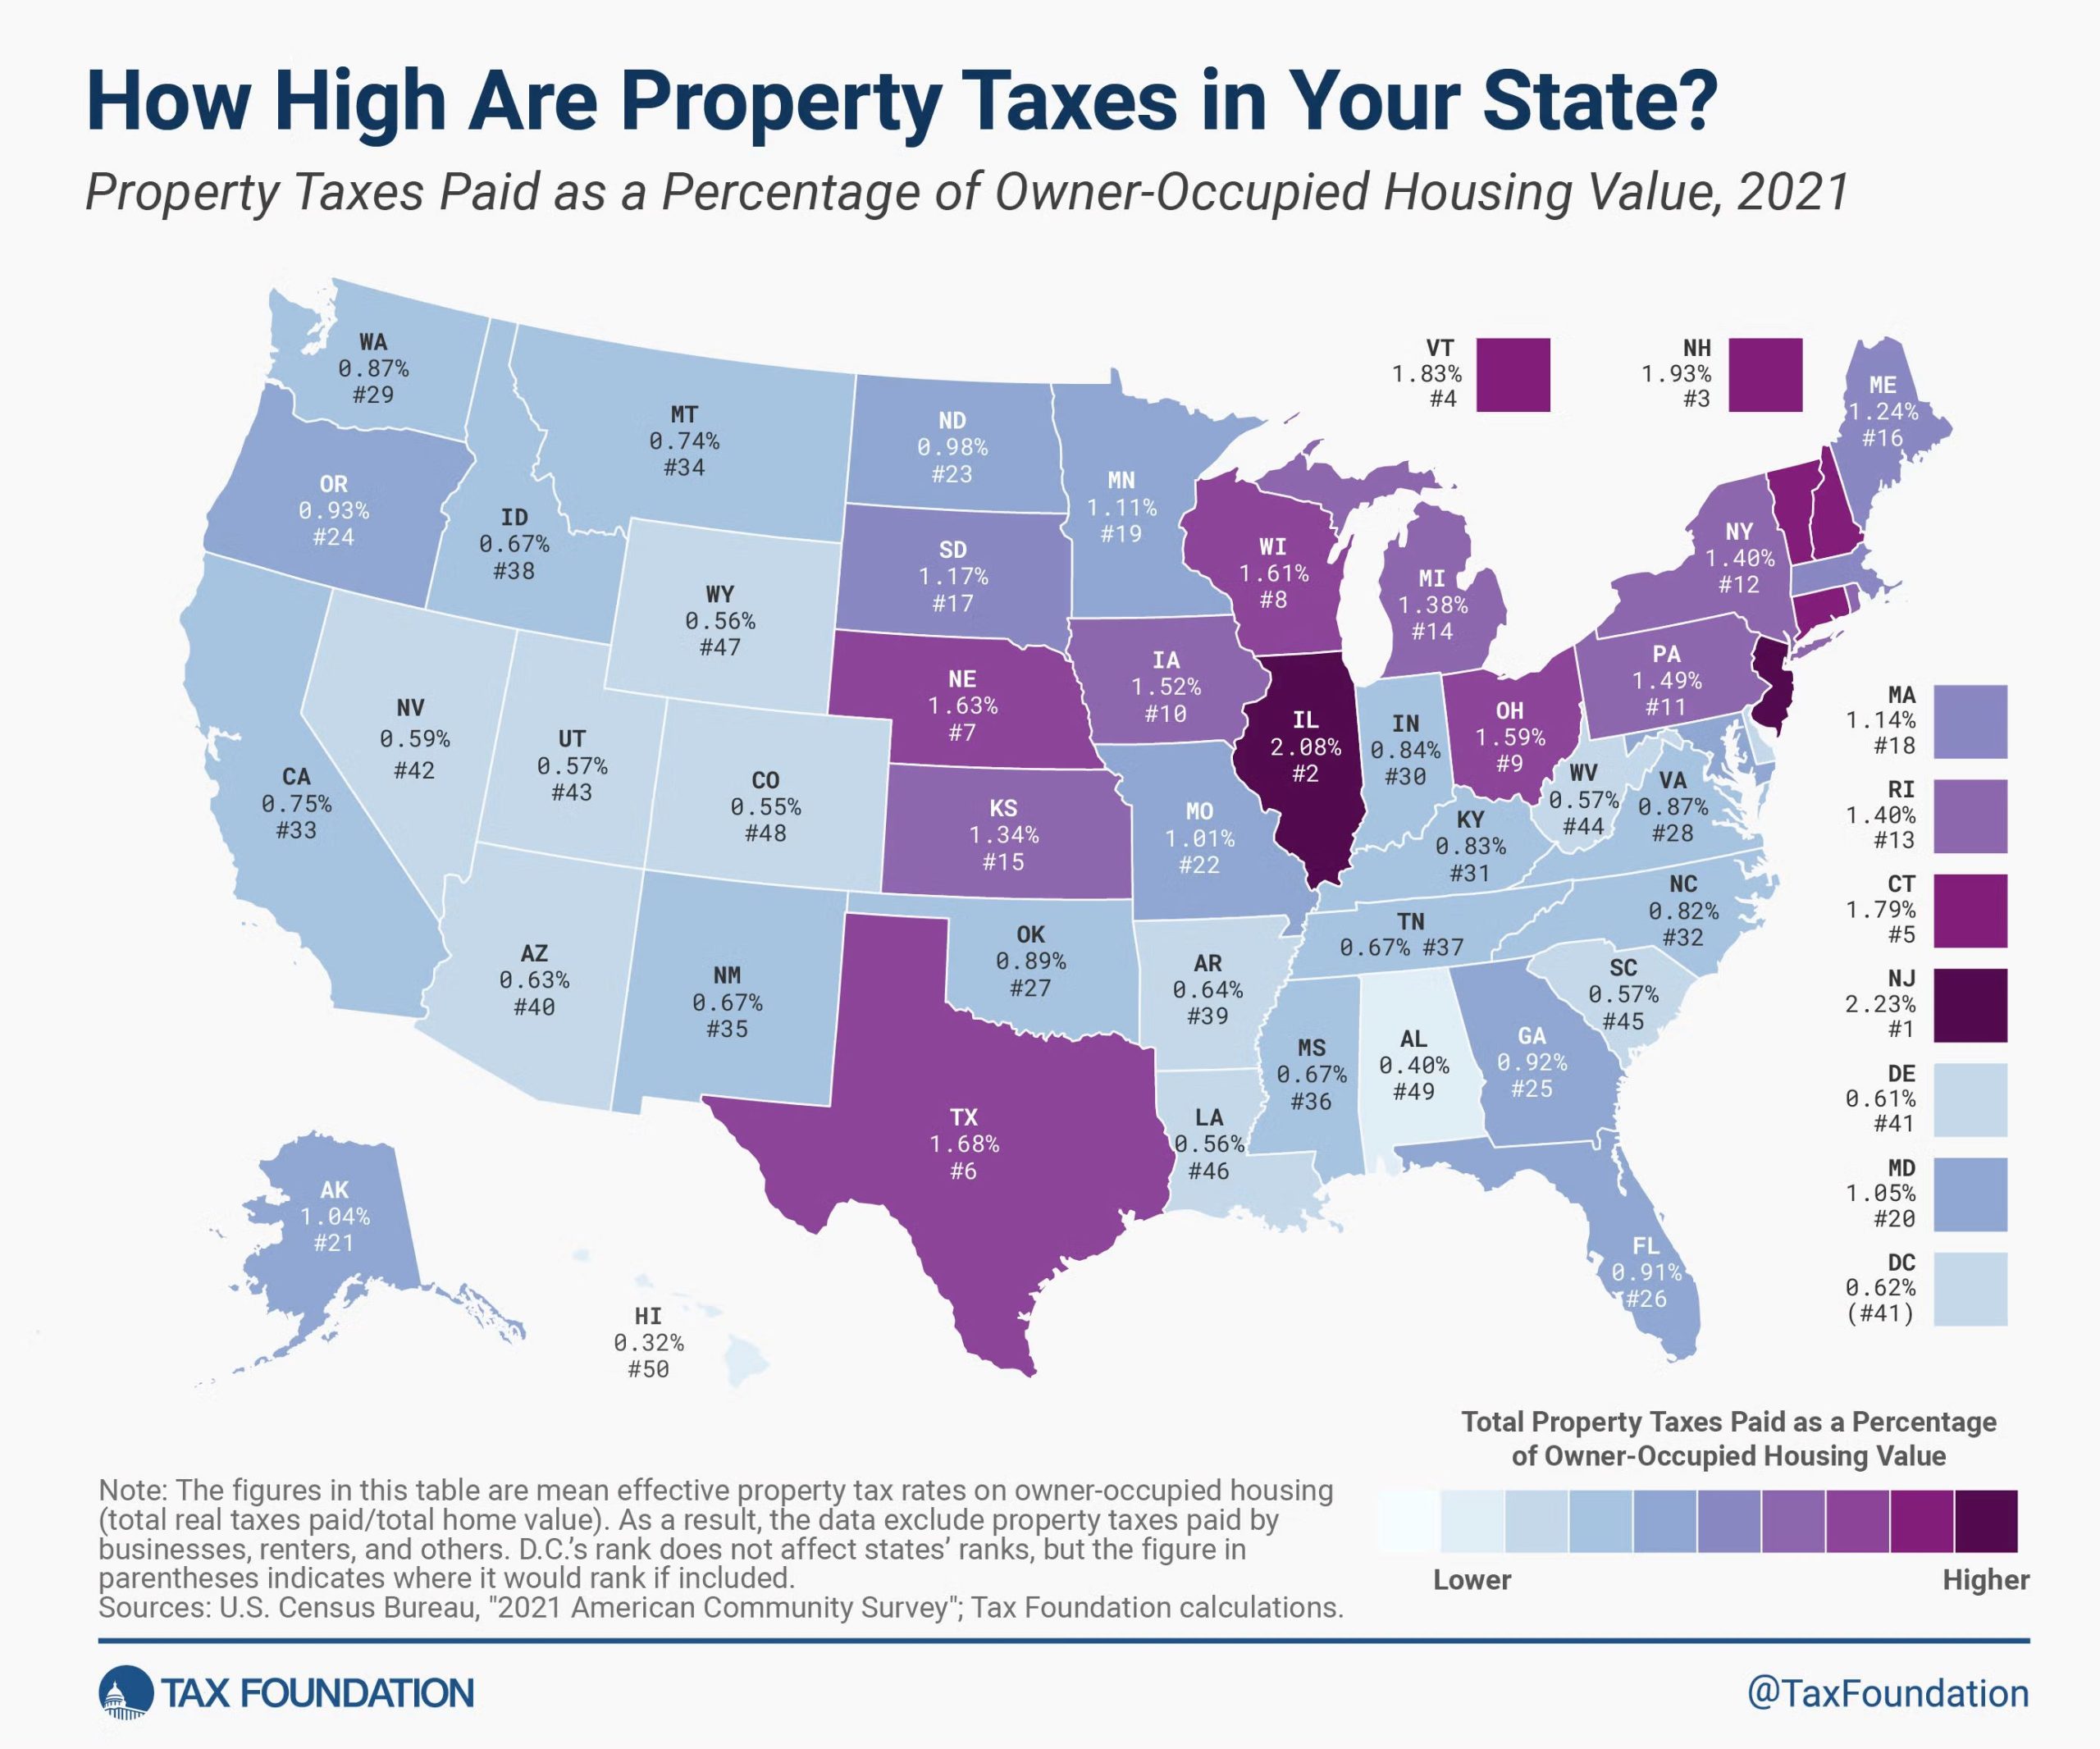
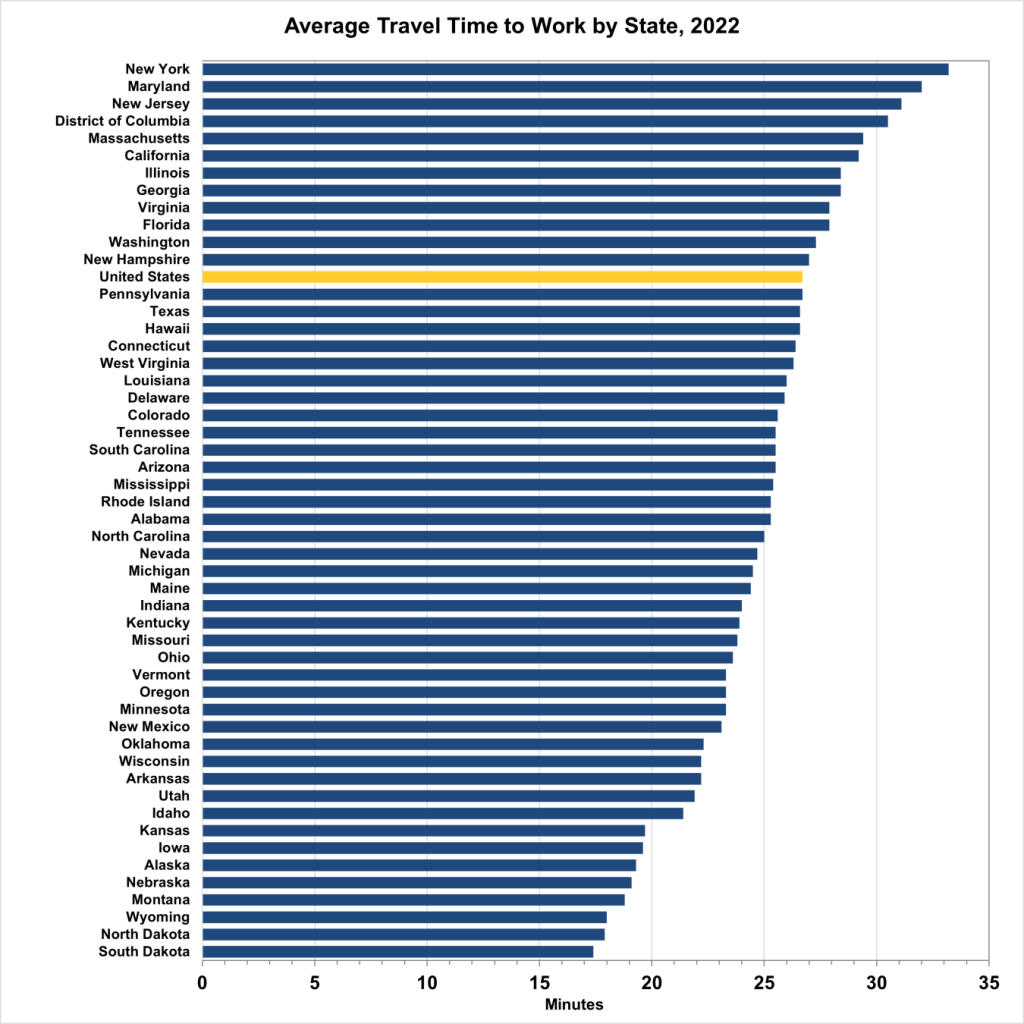
New Jersey has the highest property tax rate in the United States, and because housing prices are high, residents also pay the highest average property taxes in the nation. Several factors contribute to these costs. Residents expect high-quality public services such as public schools and transportation infrastructure, including public transit. At the same time, many New Jersey towns serve as bedroom communities for two major job centers—New York City and Philadelphia. Residents live in New Jersey but work—and pay income taxes—in neighboring states, leading municipalities to rely more heavily on property taxes.
Recent housing market pressures have intensified this challenge. Limited supply, strong regional job growth, low interest rates from 2020 to 2022, and rising construction costs have all contributed to higher home prices.
Some policymakers suggest reducing property taxes through spending cuts, but another strategy involves expanding the non-residential tax base. Encouraging commercial property development near transit—including rental properties with five or more units—can generate new tax revenue while helping retain jobs and businesses within New Jersey.
The experiences of Jersey City, Old Bridge, and Somerville illustrate how transit-friendly planning can support commercial revitalization and attract new investments. Academic research supports these outcomes. One comprehensive study on smart growth and TOD found significant reductions in both commercial and office vacancy rates. Another study examining development near CapMetro stations identified commercial rent premiums of up to $9 per square foot within a quarter-mile of stations. With office vacancy rates currently around 23 percent statewide, vibrant downtowns may help suburban communities offset lost office demand while attracting young professionals and remote workers.
Congestion
Traffic congestion remains one of the most common concerns raised about new development congestion. Due to its population density and location within the Northeast corridor, New Jersey frequently ranks among the most congested states in the country.
With the fourth round of the affordable housing obligations underway and strong demand for housing, many municipalities must accommodate growth while minimizing transportation impacts. Transit-friendly planning offers a strategy for accommodating development while reducing reliance on automobiles by offering viable alternatives such as transit, walking, and cycling.
Research supports these outcomes. One study of a TOD project in Atlanta found that residents drove significantly less than comparable residents elsewhere in the region. Mixed-use development can also reduce car trips. A nationwide study of 710 mixed-use projects found that these projects generate roughly one-third fewer vehicle miles traveled (VMT) than conventional single-use development.
Increased development near transit stations can also increase ridership, potentially creating a positive cycle of higher fare revenue, improved service, and further ridership growth, lessening car dependence over time.
Environmental Sustainability
Transit-friendly planning can advance environmental sustainability in two ways: reducing greenhouse gas emissions and preserving open space.
Low-density, separated land uses often require longer automobile trips for daily activities such as commuting, shopping, and recreation. Compact, mixed-use development reduces both the number and distance of car trips while encouraging walking and transit use.
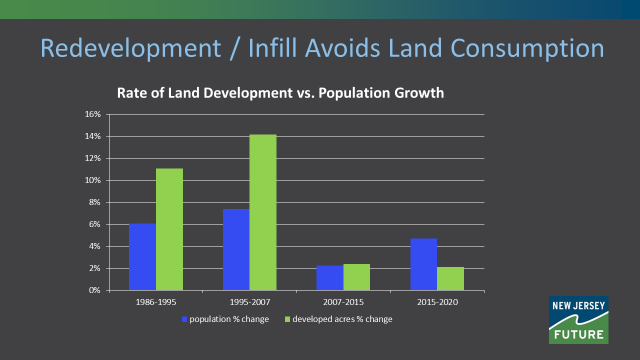
Lower vehicle miles traveled are associated with reduced air pollution, lower greenhouse gas emissions, and improved public health through cleaner air and increased physical activity. Smart growth strategies also reduce land consumption. In the 1990s and early 2000s, land development in New Jersey expanded at nearly twice the rate of population growth. Since around 2015, however, growth patterns have shifted, with population growth now outpacing land consumption by roughly two to one.
Affordability
Transit-friendly planning often sparks debate over housing affordability. Some critics worry that new development near transit may accelerate gentrification, while proponents argue that expanding housing supply can help moderate prices. Both perspectives contain elements of truth.
Housing markets are complex and vary widely by location and housing type. New TOD may increase rents within a specific neighborhood while easing pressure elsewhere in the region. In addition, new multifamily development often has a limited direct impact on nearby single-family housing markets. A comprehensive study examining the relationship between TOD and gentrification found mixed and inconclusive results.
Even when housing prices remain high, transit-friendly communities can reduce another major household expense: transportation. In 2024, the average U.S. household spent $13,318 on transportation. Research shows that car-free households spend roughly 50 percent less of their income on transportation than households that own cars.
Taking the First Steps: A Roadmap for Communities
For many New Jersey municipalities, the shift toward transit-friendly planning can feel overwhelming. In practice, the process usually happens in incremental steps. Communities begin by understanding local conditions, then align policies, and finally implement projects that attract new investment.
Phase 1. Assessment and Visioning
Transit Friendly Checklist
Existing Data Review
Walkability Audits
Business, Housing, and Land Use Inventories
The first step is developing a clear understanding of local conditions and community priorities.
Municipalities can begin by completing NJ TRANSIT’s Transit Friendly Planning (TFP) Checklist, reviewing demographic and land use data, and conducting walkability audits around transit facilities and major corridors. Additional assessments—such as inventories of local businesses, housing stock, and underutilized properties—can help identify redevelopment opportunities.
Community engagement is also critical during this phase. Neighborhood meetings, walking tours, design charrettes, and surveys help municipalities gather input while building public support for future changes.
Many municipalities also seek technical assistance during this stage. NJ TRANSIT’s Transit Friendly Planning program offers support with data analysis, community engagement, and corridor planning. Since 1999, the program has partnered with communities across the state to produce station area studies, vision plans, and redevelopment strategies.
Similarly, the New Jersey Department of Community Affairs (NJDCA) Office of Local Planning Services provides technical assistance for redevelopment planning, land use analysis, and economic development strategies.
Phase 2. Policy and Regulatory Alignment
Zoning Updates (e.g., mixed-use, missing middle housing)
Parking Reform
Complete Streets Policies
Once a community establishes a vision, the next step is aligning local policies and regulations to support it.
Zoning updates often play a central role. Municipalities may allow mixed-use development, increase residential density near transit facilities, and permit “missing middle” housing such as duplexes, triplexes, and small apartment buildings. Adaptive reuse of underutilized buildings can also help revitalize station areas while preserving existing structures.
Transportation policies may also need adjustment. Reducing or eliminating minimum parking requirements and adopting Complete Streets policies can improve safety as well as pedestrian and bicycle access to transit.
Several state programs can support these improvements. The NJDOT Safe Streets to Transit program funds projects that improve pedestrian and bicycle access to transit facilities.
Municipalities may also establish Special Improvement Districts (SIDs), allowing property owners and businesses to collectively fund streetscape upgrades, maintenance, and beautification along commercial corridors. In addition, communities can use Payment-in-Lieu-of-Taxes (PILOT) agreements to incentivize redevelopment near transit facilities or on underutilized properties.
Phase 3. Catalyzing Growth and Investment
Technical Assistance
Pilot Projects
Transit Village Designation
Once policies are in place, municipalities can begin implementing projects and attracting investment.
Pilot projects are often an effective way to test transit-friendly ideas at a relatively low cost. Temporary street closures, outdoor dining programs, pop-up markets on station parking lots, or temporary pedestrian plazas allow communities to evaluate how design changes affect activity and mobility. Successful pilots can later become permanent.
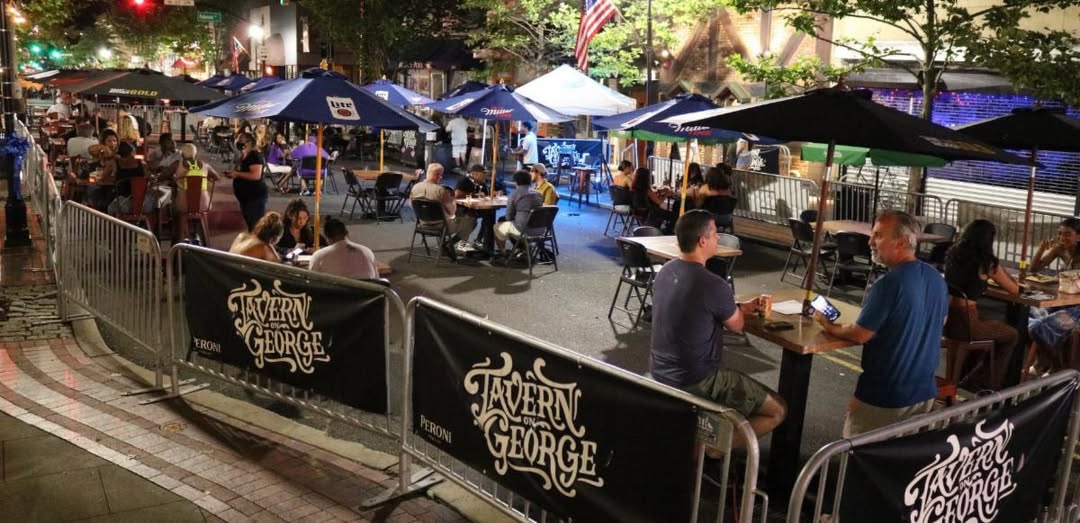
For example, in New Brunswick, portions of George Street near the city’s train station were temporarily closed to vehicles during the COVID-19 pandemic. The pedestrian-friendly environment proved popular and is now implemented as a recurring summer program.
Municipalities can also partner with NJ TRANSIT on TOD projects, particularly when underutilized transit-owned land is available. Under NJ TRANSIT’s Transit-Oriented Development Policy Statement, joint development proposals must meet several requirements, including providing at least 20 percent affordable housing, using ground leases, paying prevailing wages, and reinvesting a portion of project revenue into station area improvements.
Examples of NJ TRANSIT joint development projects include Somerville Station, Metropark Station, and Hoboken Terminal.
Several state programs can also help communities fund improvements and attract investment. The New Jersey Transit Village Initiative distributes funds for station area improvements and infrastructure upgrades to municipalities admitted into the program. Transit Village communities must demonstrate a commitment to compact, mixed-use development around transit facilities.
The New Jersey Department of Community Affairs also administers Small Cities Community Development Block Grants, which support economic development, community revitalization, and public facility improvements that benefit low- and moderate-income residents. The Main Street New Jersey program provides funding to designated communities implementing downtown revitalization strategies.
Final Thoughts
Transit-friendly planning is ultimately about expanding choice.
It gives residents the option to walk to local shops and restaurants. It allows seniors to age in place near services and transit. And enables communities to grow their economies without adding more traffic to already congested roads.
By taking incremental steps—starting with assessment and visioning, aligning policies, and implementing targeted projects—New Jersey communities can move from reacting to growth to proactively shaping a more sustainable and vibrant future.
For more information on transit friendly planning strategies, explore additional NJTOD resources:
Beyond the Half-Mile Circle: Expanding First-Mile, Last-Mile Access to Transit
Creating Places for People: Placemaking in Transit-Friendly Downtowns
Gentle Density: Tactics for Small-Scale TOD
Infill Development: Balancing Growth, Transit, and Sustainability
Planning for Transit-Friendly Food Access
Recap: People, Parking, and Planning
Recap: Rethinking the Right of Way
What’s Taxes Got to Do with It? Exploring PILOTs
Sources
2025 Annual Report: Shaping the Future | NJ TRANSIT
Average NJ Property-Tax Bill Hit Another Record High Last Year | NJ Spotlight News
Beyond the Tracks: TOD for New Jersey’s Bus Riders | NJTOD
Do Mixed-Use Developments Optimize VMT and Emissions Reduction? | Transportation Research
Economic Development and Smart Growth | International Economic Development Council
Employment Patterns in New York City | Government of NYC
Exploring Transit Village Communities Along the Raritan Valley Line | NJTOD
Household Spending on Transportation | Bureau of Transportation Statistics
Infill Development: Balancing Growth, Transit, and Sustainability | NJTOD
Jersey City Set to Add Nearly as Many Apartments as Manhattan in 2024 | Jersey Digs
Jobs Recovery in City Outpaces State and U.S. | The New York Times
Learning from Jersey City | Vital City
Measuring Benefits of Transit Oriented Development | Mineta Transportation Institute
NJ TRANSIT Transit-Oriented Development Policy Statement | NJ TRANSIT
The Influence of Infill Development on Travel Behavior | Research in Transportation Economics
The Mismatch Between New Jersey’s Output and Income | NJ Spotlight News
Transit Friendly Planning: A Guide for New Jersey Communities | NJ TRANSIT
Transit-Oriented Development and Gentrification | Transport Reviews
Value Added Effects of Transit-Oriented Development | Papers in Regional Science